How to deploy a custom Attio dealflow dashboard with Evidence

In this guide, we'll show you how to build and deploy your own Attio sales data dashboard using Replit.
This tutorial takes a unique approach. We'll start by introducing the tool and explaining how to deploy it on Replit. Then, we'll jump into the app's architecture, our development process, and how you can create similar, valuable tools for your team.
Forking your own app #
"Forking" a Repl creates a copy in your own environment. We've prepared a template to jumpstart your project.
- First, navigate to the Repl's cover page and click Fork. You might need to log in first.
- You'll enter the Replit Workspace, which resembles a classic code editor. This cloud-based environment allows you to edit and run code remotely, providing a seamless experience.
- Think of a Repl as a virtual environment where code runs remotely. This means you don't need to worry about installing languages or configuring packages yourself. Replit simplifies the package management process. In this Repl, for instance, all the necessary languages and packages are pre-installed and configured for you.
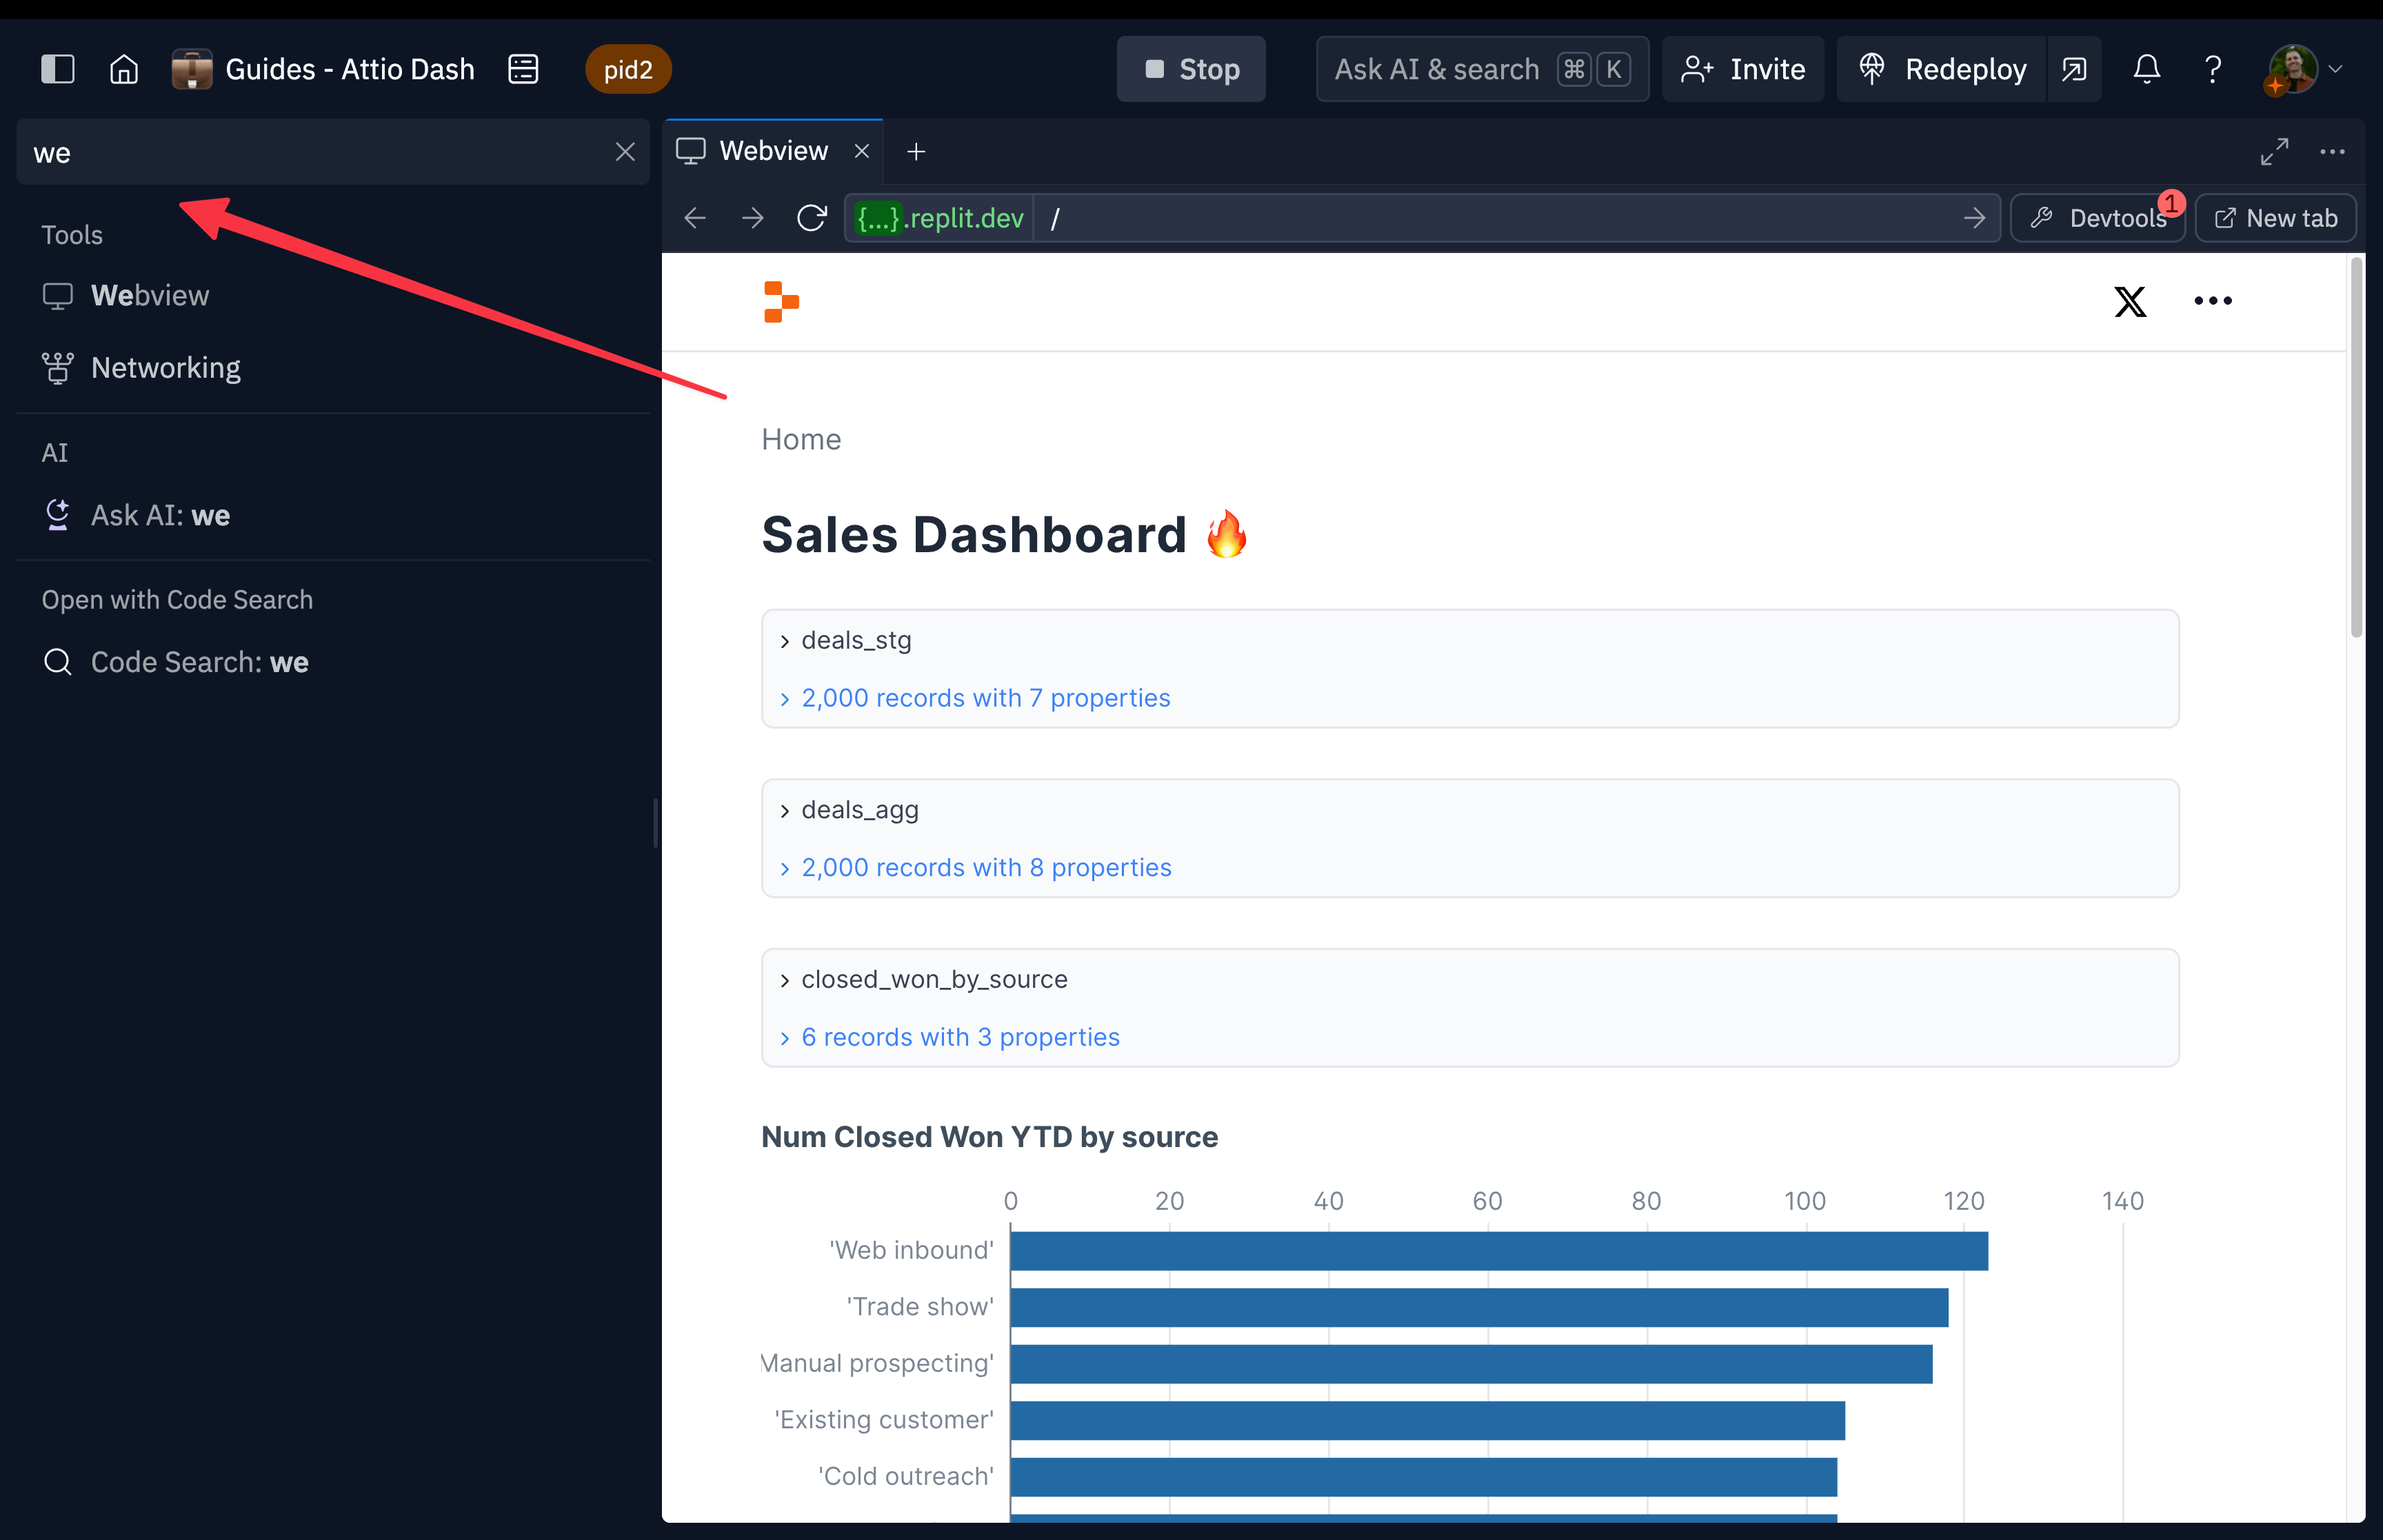
- Next, click the "Run" button. You'll see some output and a new "Webview" pane should appear. If it doesn't, open one by searching for "Webview" or clicking the plus icon next to an existing tab.
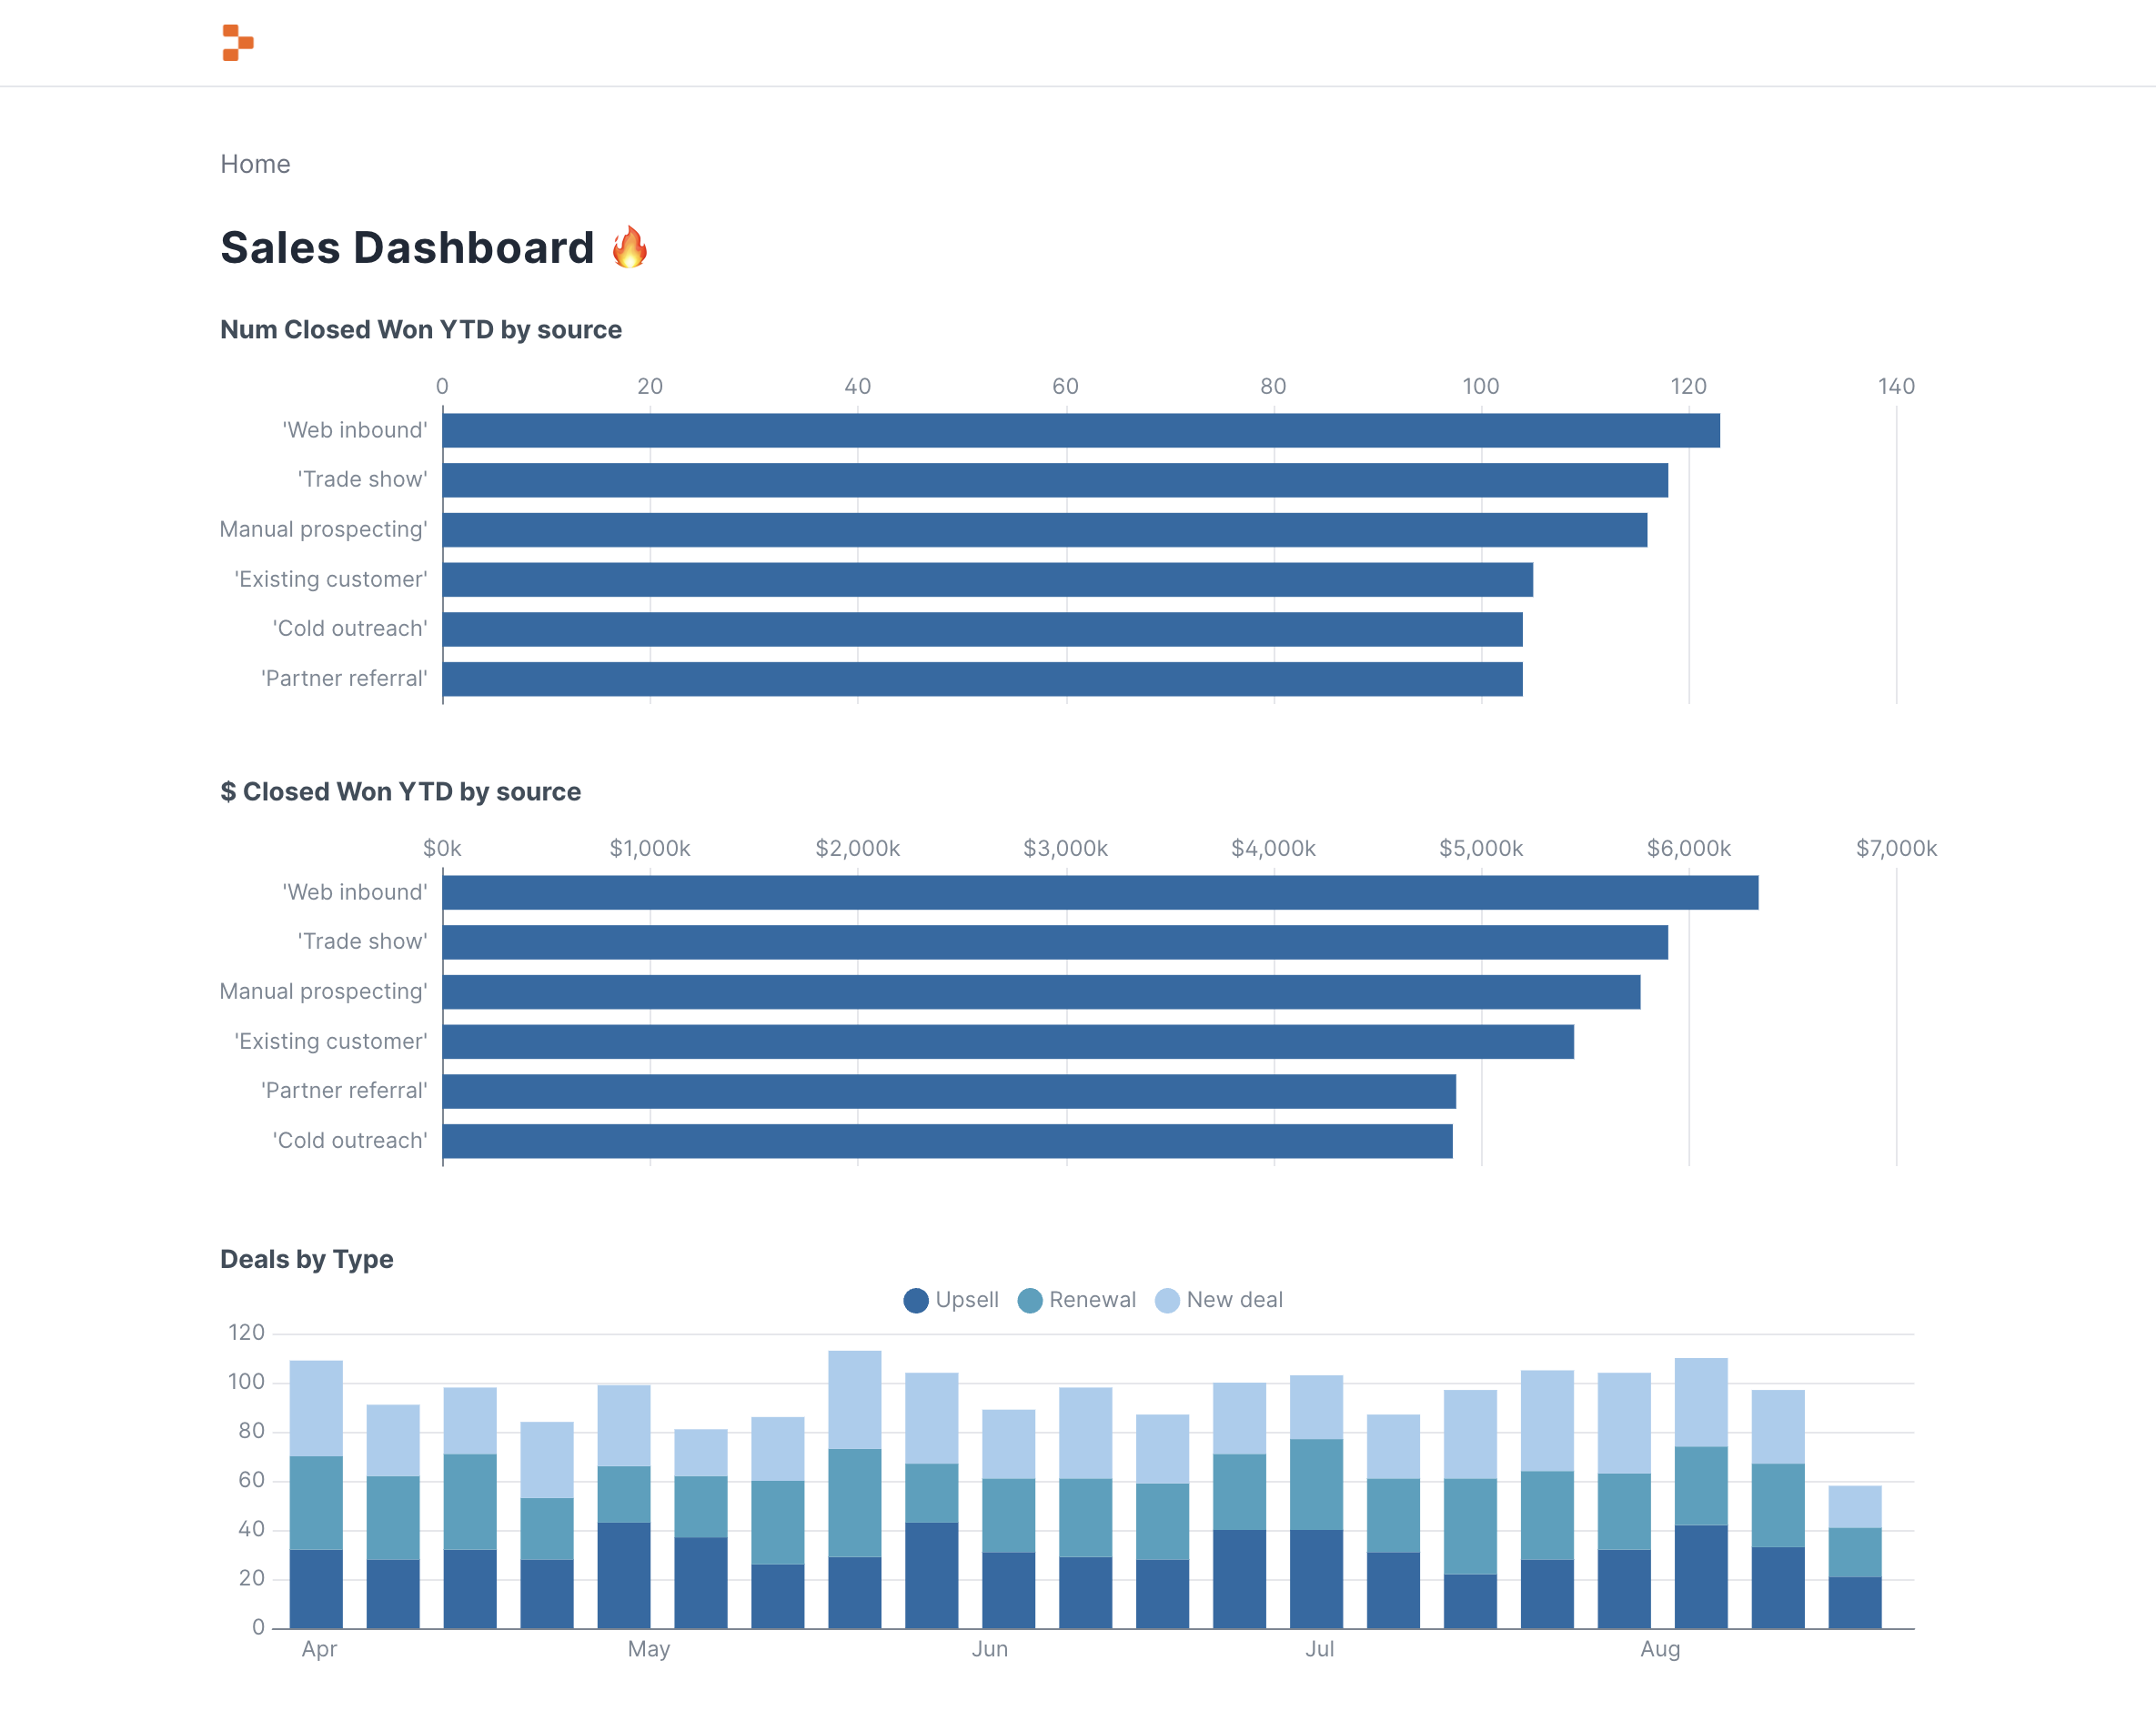
- Explore the dashboard! Evidence offers interactive charting with rich tooltip data and engaging metrics. Note: This app uses fake data generated by the fake.py file.
Deploying your app #
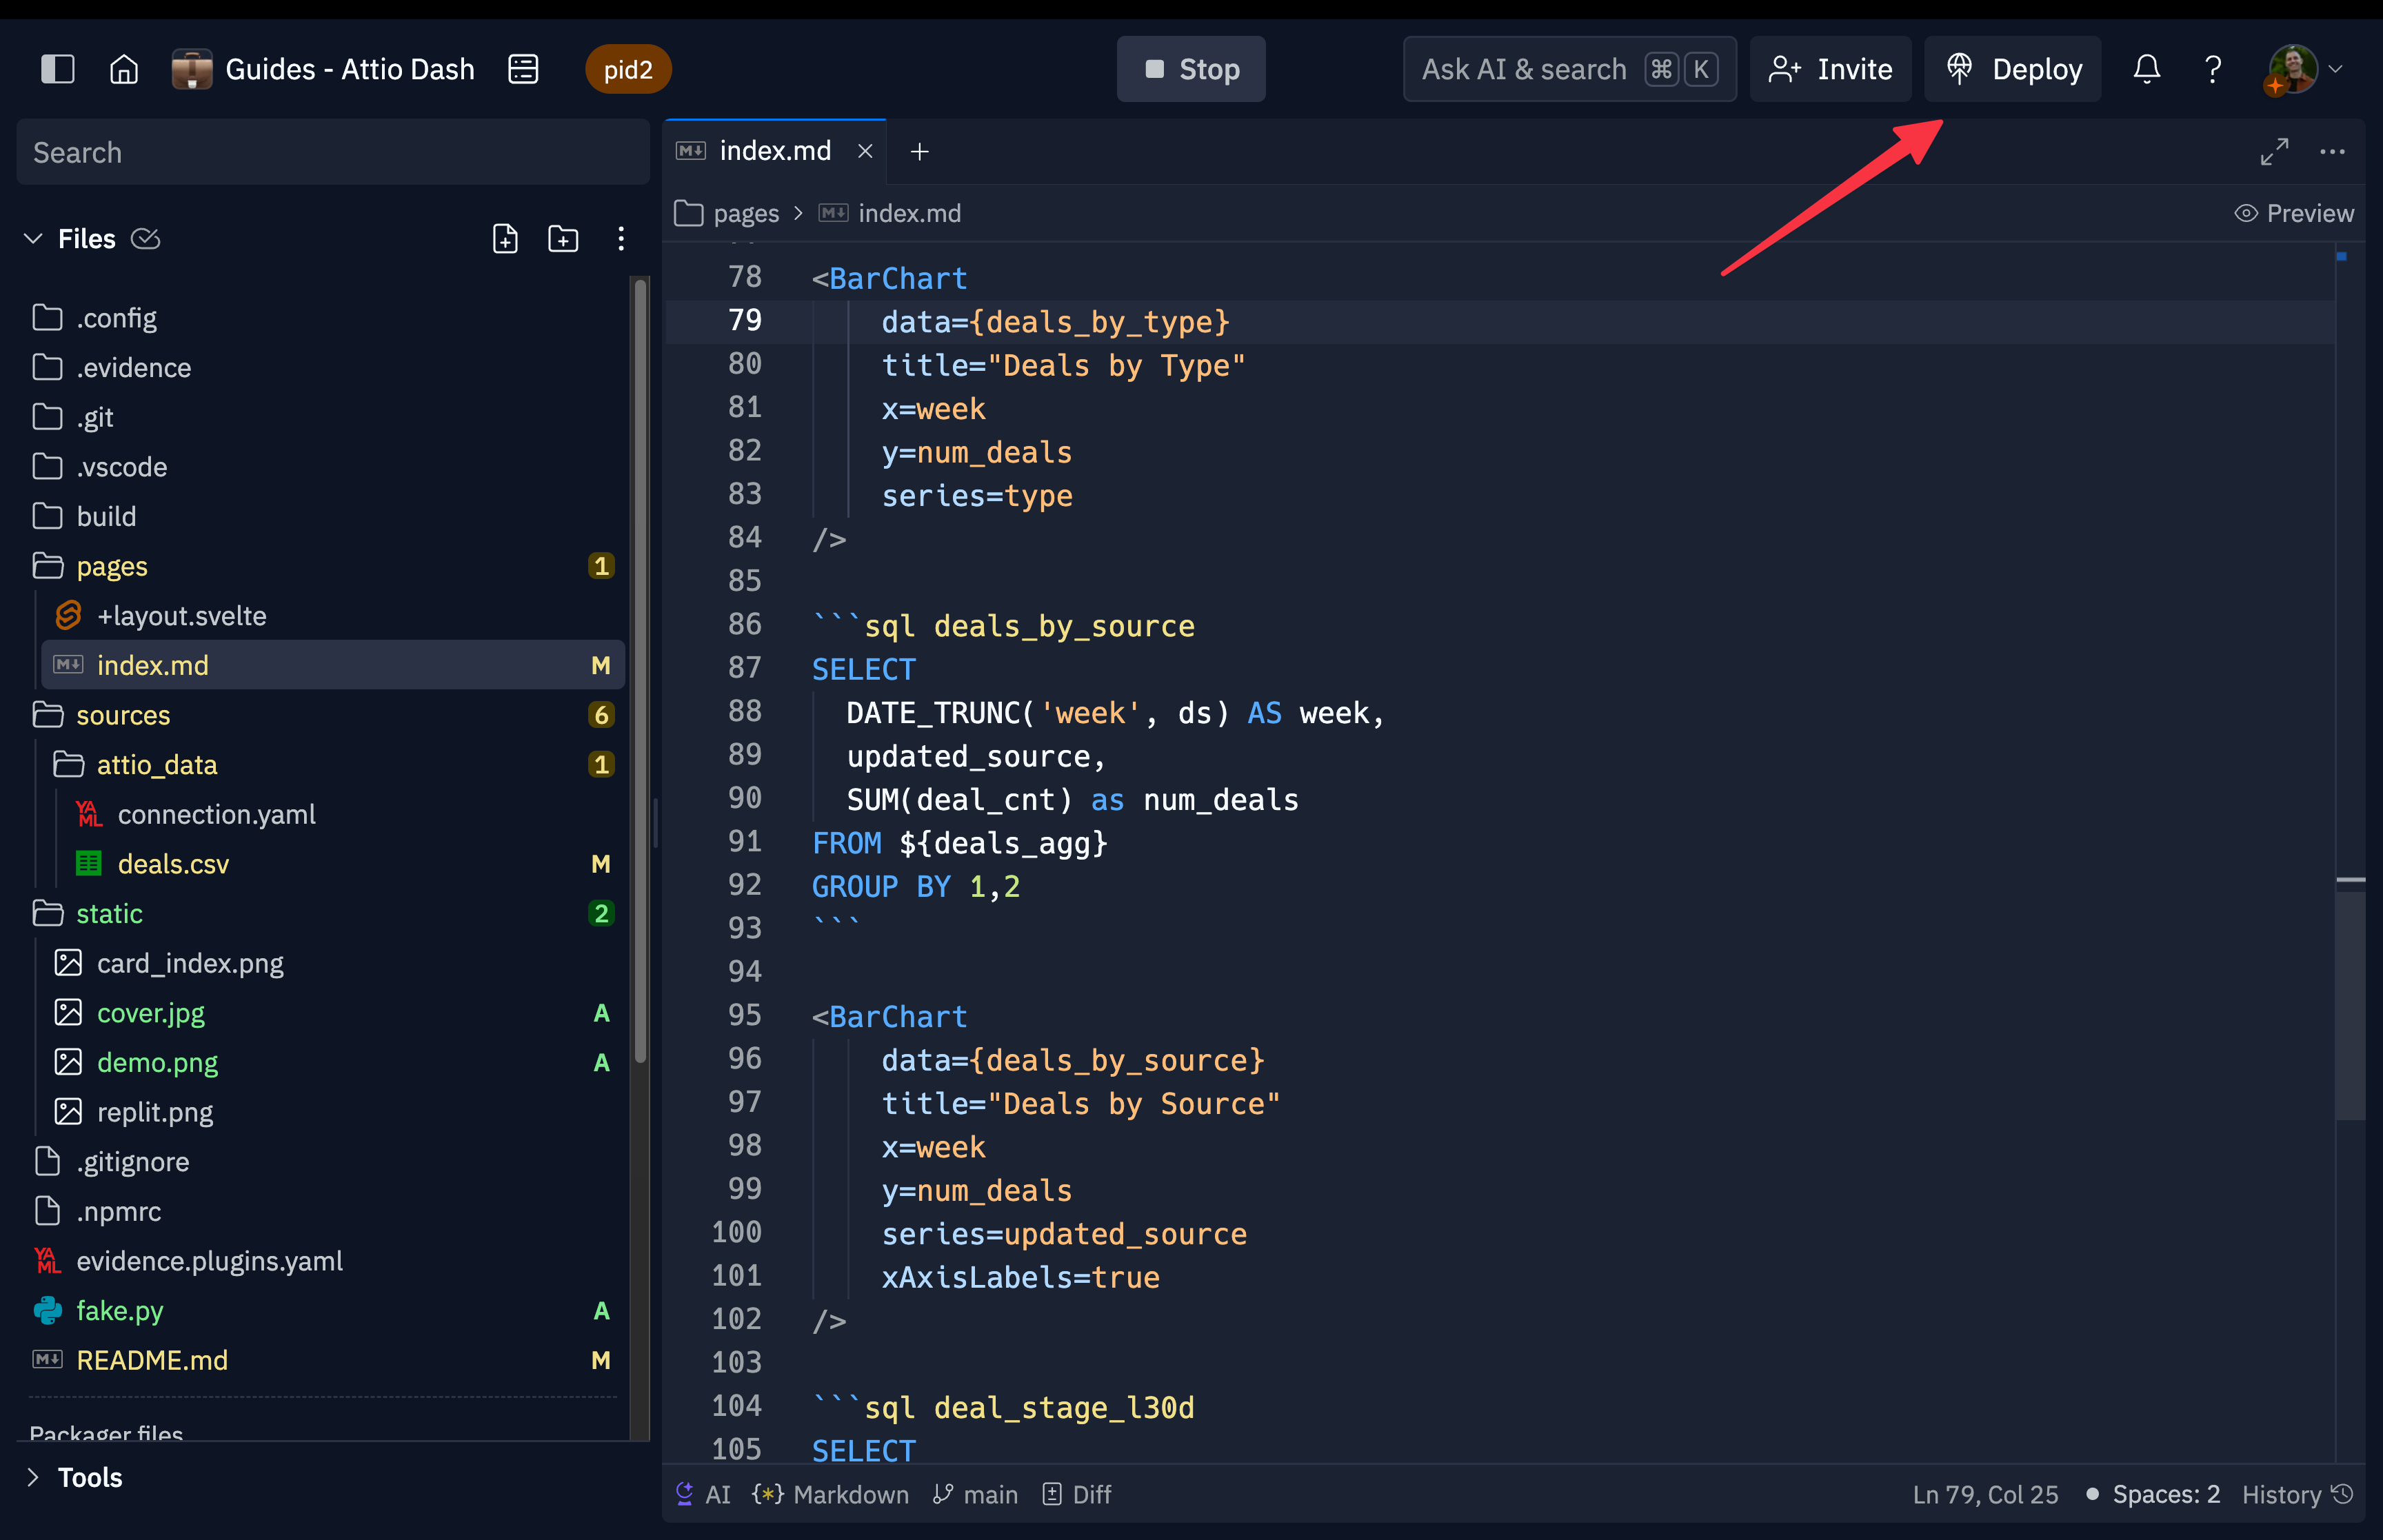
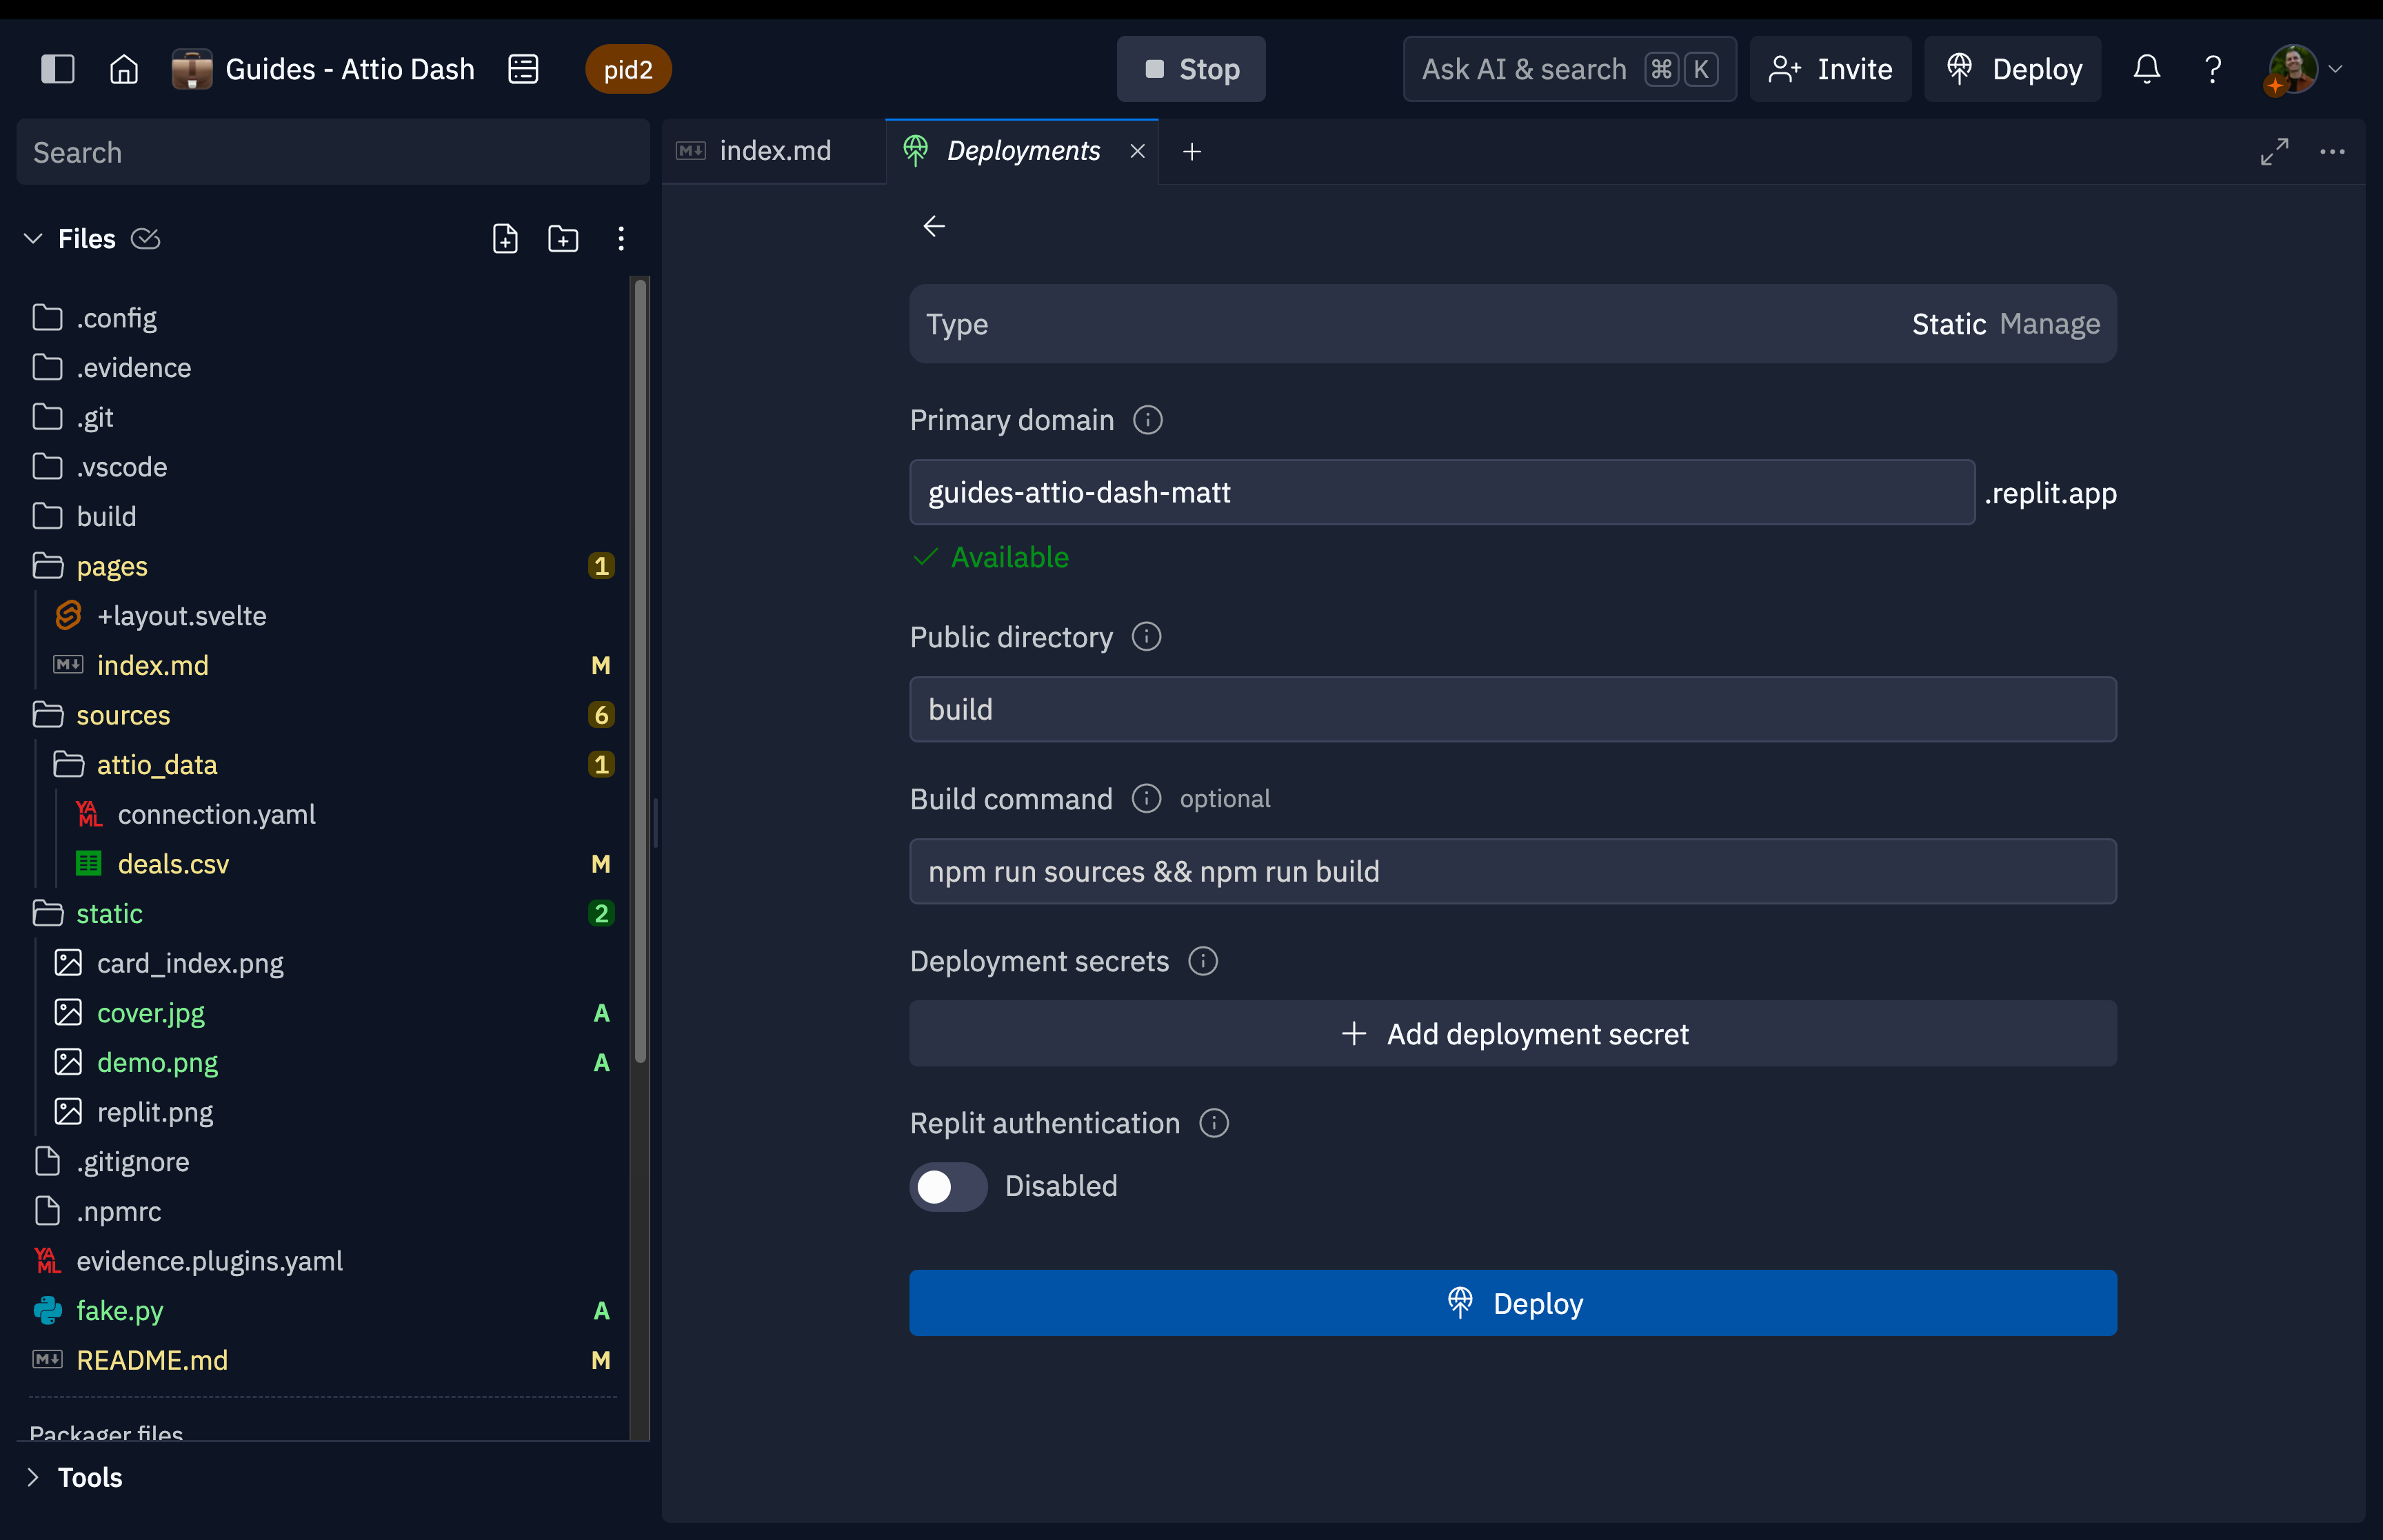
- Now, let's deploy your app. Click the "Deploy" button.
- We'll use Static deployment for our app. Static apps run entirely in the browser. Evidence, being a static framework, compiles your application into HTML files that Replit serves statically.
- You can use the default settings for your application—we've preconfigured everything. Evidence builds to the build directory, triggered by the npm run build command. We've also added npm run sources to ensure up-to-date sources.
- Click "Deploy," wait a few minutes, and your app will be live at your domain.
What we built #
Evidence is an open-source business intelligence and data visualization framework for creating interactive dashboards and reports using SQL queries and Markdown.
Here's an overview of the framework and project configuration:
- Evidence uses SQL for data queries, Markdown for layout and text, Svelte for rendering and interactivity, and Tailwind CSS for styling.
- Project Structure
- /pages: Markdown files for each page/report
- /sources: Data source configurations and SQL queries
- /static: Static assets like images
- evidence.plugins.yaml: Plugin and data source configurations
- For our template, we:
- Initialized a new project,
- Configured our data source,
- Wrote SQL queries in index.md. Evidence uses DuckDB SQL to query CSVs
- Charted data using Evidence's Components
- Generated fake data with fake.py (sources/attio_data).
The commands we used to spin up our Evidence instance:
Building a dataset in Evidence:
Generating a sample bar chart in Evidence:
By combining SQL queries with Markdown and Evidence's built-in components, we created a comprehensive report. The framework manages data fetching, rendering, and interactivity, allowing you to focus on analysis and presentation.
Using Replit Deployments, we quickly made the app live in just minutes. We used a CSV in this example, but Evidence supports a number of data sources.
With Replit, we were able to quickly spin up a development environment, edit our code, and push our app live to a custom URL.